See It In Action
Two Interfaces. One Binary.
A full-featured Web UI and a keyboard-driven Terminal UI — both shipped inside the same 17 MB binary.
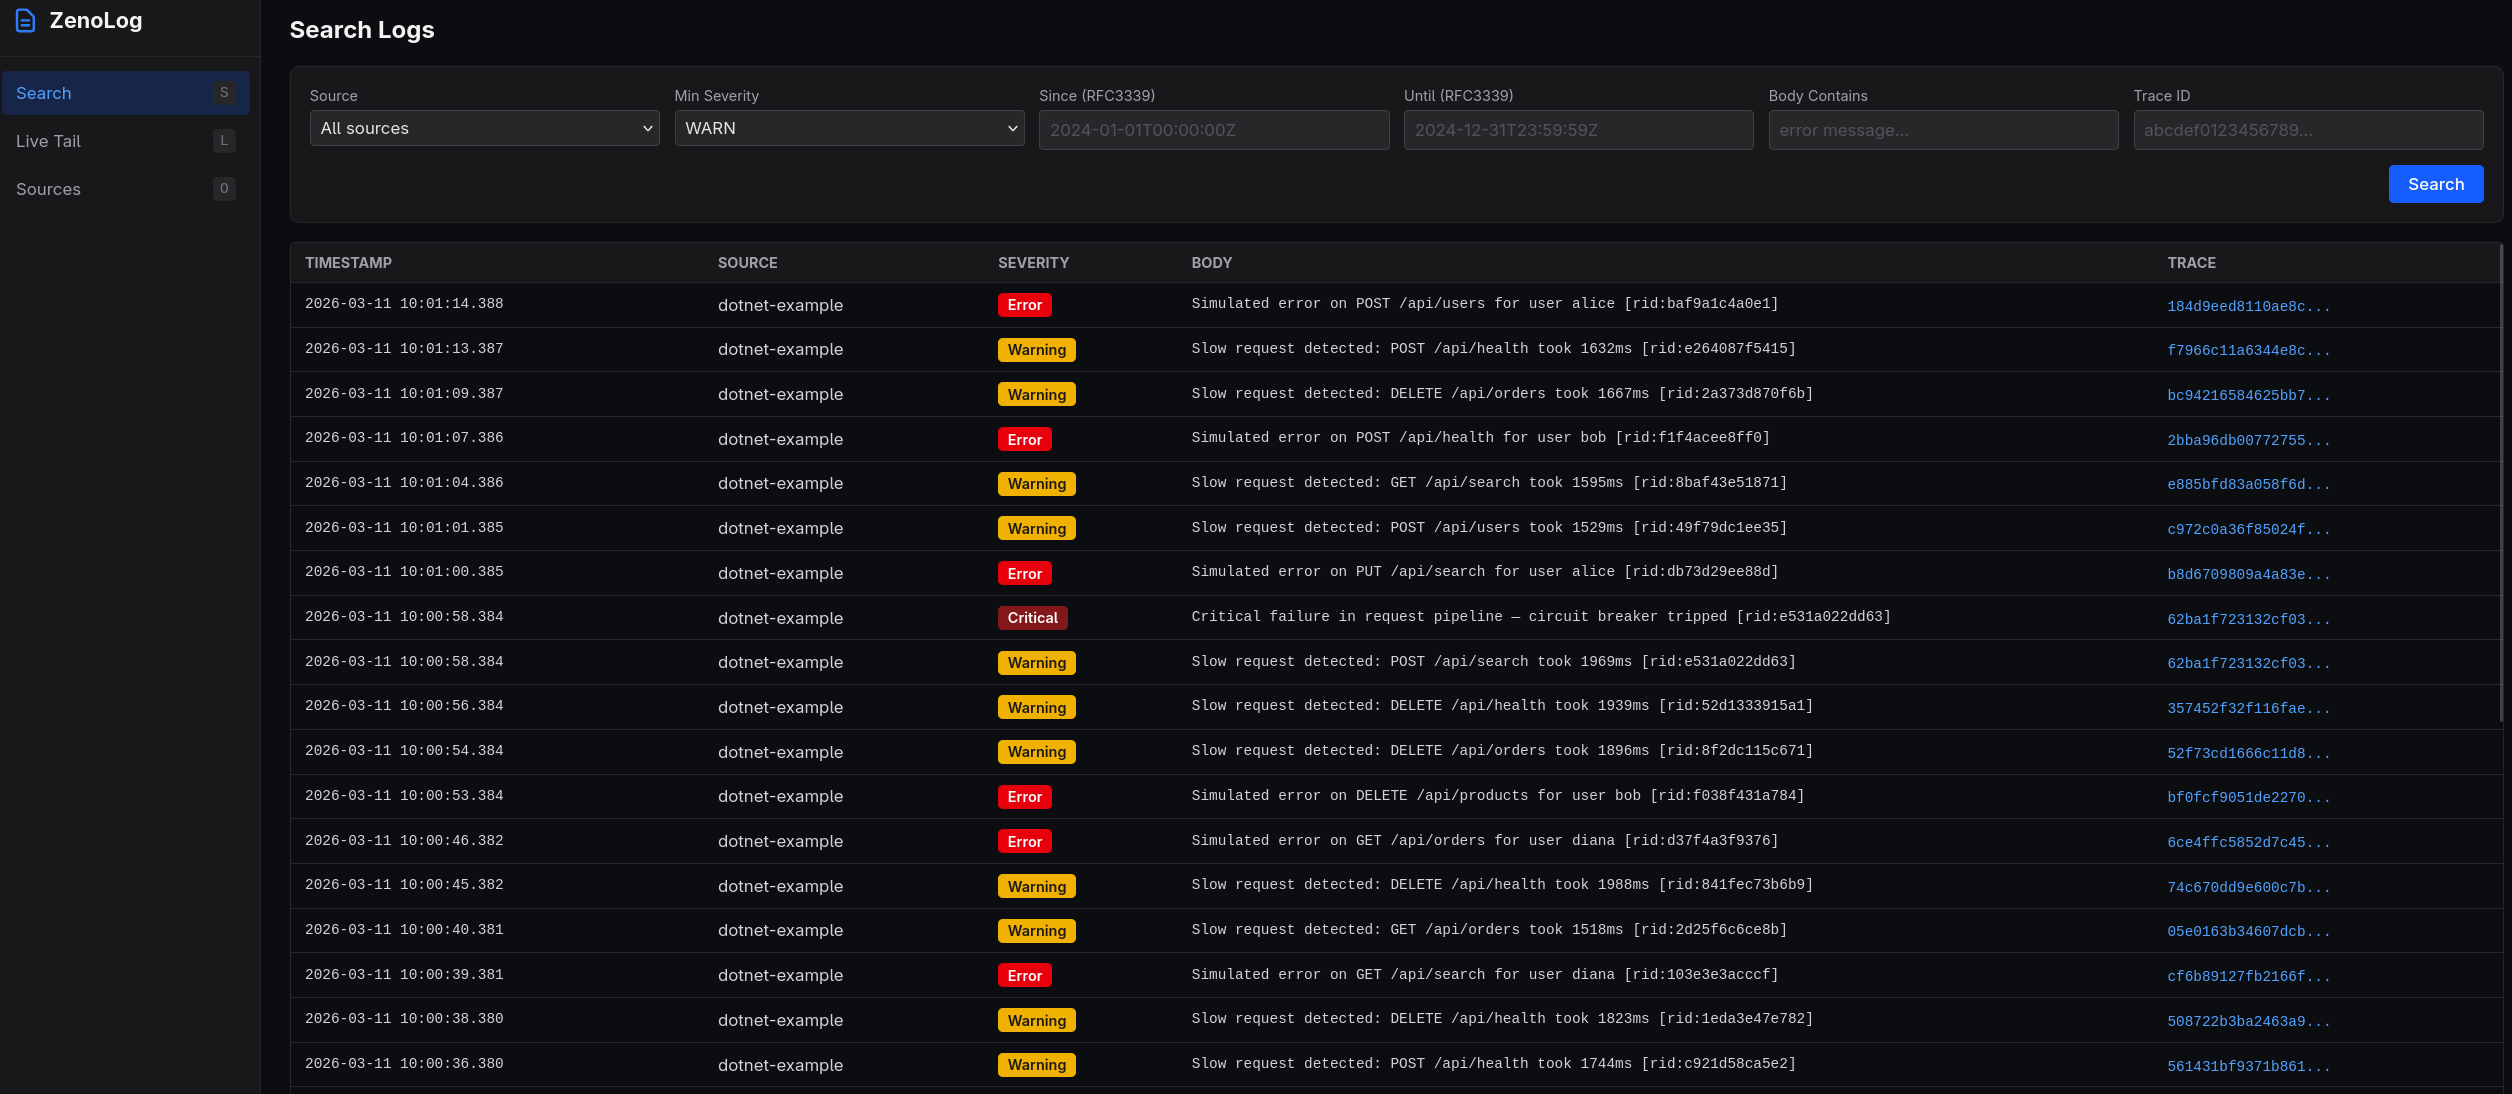
Web UI — Search
Web UI — Live Tail

Web UI — Trace View

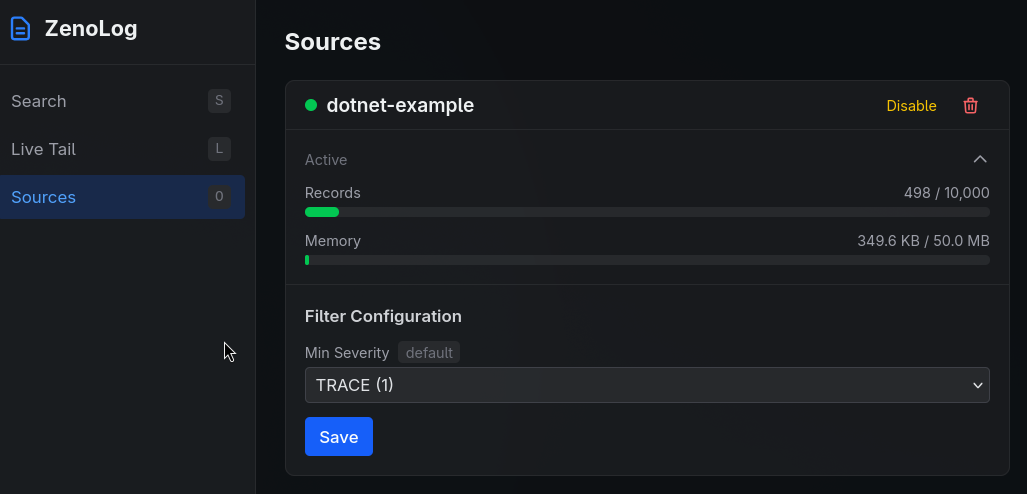
Web UI — Sources
Terminal UI — Live Tail

